Quality & Risk Management
SBS- MSC
Assignment
GENERAL INSTRUCTIONS
- APA 7th edition referencing guidelines needs to be followed.
- Similarity between student’s work is strictly not accepted, any student found with similar work will be graded Zero and fail for the course. However, Plagiarism is an academic offence and will not be tolerated.
- Any revaluation request should come in 5 days of grade release. Any late request will not be obliged.(Form and other details shall be shared based on request)
- Revaluation cannot be requested for plagiarized assignments as the assignment stands as an academic misconduct.
- If a program participant submits the assignment late, but within 1 week after the submission date a 20%penalty will be applied
- Re-evaluation request is NOT applicable for any failed courses provided the mark range from 59 to 69.Any grade which is below the range is however not applicable for this request.
- Any rescheduling request can be fulfilled within one week after the actual date of the assessment. Anylate request will not be obliged.
- Assignment once submitted to exam board is final for marking.
- Second extension cannot be provided without supporting documentary evidence.
- Program participants are strongly advised to keep a copy of their work in case the submitted copy should go astray.

PS. Kindly note to adhere to all the above instructions. Failing to read this, ATMS will not be responsible for any actions taken.
Total Marks / 90
PLAGIARISM
Plagiarism is defined as providing material from an uncredited source, or without the acknowledgement of the original author. For longer submissions and reports, students are required to provide an Assignment Cover Sheet, which states that submission is their original work, and has not been submitted for another assignment, either in that course, or another
Plagiarism may have many forms including but not limited to:
-
- Outright copying another author’s work without acknowledgement
- Cut and paste without the correct citation and acknowledgement
- Copying key words but changing the sentence structure without crediting
the original source - Copying the sentence structure but changing some words without crediting
the original source - Following the structure or organization of another author’s work, or order
of presentation of ideas - Copying from published authorities without acknowledgement
- Failure to correctly use quotation marks when expressing another author’s idea
- Incorrect or improper use of in-text citation and referencing
- Missing or incorrectly presented bibliography or reference list
- Pretending ownership of another author’s ideas
- Making work available to another person for copying
- Falsifying results
- The plagiarism tolerance for MBA is 8 %.
- In cases where the plagiarism percentage exceeds the tolerance, students are given a second chance to rework on their assignments and submit. However, if the percentage continues to exceed the tolerance percentage the student will be awarded one grade lower than the original grade achieved.
Assignment
Answer the following questions:
Part A (Maximum 1500 words)
This part requires access and careful review of the case study below.
- What is the cancer’ s center’s main area of improvement?
- What were the initial steps identified by the consultant as having most waiting from referral to diagnosis?
- There were 3 proposed models as solutions. Which seems to be the costliest? Why?
- Which tool from Lean methodology was used to prioritize the best solution?
- Why did the staff agree to conduct Value stream map without the consultant’s
intervention? - What were the risks identified by the team members in this improvement project?
- What did the staff discover after drawing their VSM (value stream map and patient)?
- What were the results? How did they measure the outcomes?
- What is Lean methodology? Highlight from external references of your choice the literature that supports Lean’s impact on improvements in organizations.
- If you were assigned to improve the compliance to health regulations standards, what
tools from quality discipline would you use to achieve this?
Part B (Maximum 2000 words)
- There are many tools in quality discipline, describe 3 tools used to analyze the problems and/ or causes of problems. Give an example of each tool. Show how to use each tool.
- Develop a PDCA project for any topic of your choice, address each stage with data and figures using proper tools from quality discipline.
Case Study
Abstract
Sarah had six months to meet her hospital cancer center’s target of diagnosing 65% of all patients within 28 days of referral. Funding from her grant source would lapse, and unless she could shorten the assessment timeline, patient volumes would remain too low to make up for the funding loss. Despite the best efforts of management and staff, and repeated internal attempts to improve performance, the center was ranked in the bottom three of all similar centers in the province. To address this ongoing problem and be able to add patient capacity, the center contracted a consultant to analyze and identify ways to improve the process, which involved both clinical and diagnostic functions, not to mention several communication and handoff points.
After interviewing key staff members and observing processes at the center, the consulting team offered Sarah some options for how they could proceed, each with different risks, advantages, time commitments, and price points. Sarah needed to make a choice quickly so the team could dig into their work.
The Challenge: Long Wait Times From Referral to Diagnosis
In December 2014, after struggling to reduce lengthy patient wait times for diagnostic assessment, Sarah, 1 the manager of the cancer center, enrolled the center in a provincial program that supported improvements in cancer diagnosis processes. The mandates of this program included assigning a patient navigator to guide patients through the diagnostic process and reducing wait times so that 65% of all patients would be diagnosed within 28 days of referral. Between 2014 and 2017 Sarah tried various solutions that targeted different parts of the patient journey but did not consider the assessment process holistically. She hired more staff and then invested in more testing equipment, but neither approach meaningfully affected the metrics she needed to change the most (the number of patients served and the average time interval between first referral and final diagnosis). The solutions had caused some local improvements while the total process remained long and inefficient. As a result, the center remained in the last three places in provincial rankings of cancer centers’ performance. In December 2017, Sarah was informed that funding for the program would be cut off if her center’s evaluations did not improve in the next six months.
Sarah discussed the problem with the department managers and, after analyzing the previously applied solutions, they concluded that she needed to look at the assessment processes in terms of who does what, how many handoffs are involved, where the redundancies are, and how long each segment takes. Consequently, she decided to issue a request for proposals for a third party to analyze the center’s processes based on Lean principles. She knew from prior experience that Lean management principles are sound and effective in process improvement.
Initial Evaluation
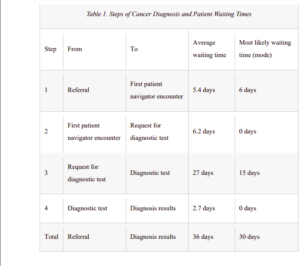
The consultant team consisted of Sanaz (project manager and data analyst), Morteza (solution designer), and John (solution designer). They began by interviewing approximately 25 staff members and observing the center’s processes. The process of cancer diagnosis starts with the patient’s appointment at a clinic with specialist doctors. When the presence of cancer is suspected, the patient is referred to the cancer center for diagnostic tests. The consultant team identified four steps in which most waiting happens between the referral and the diagnosis:
- From referral to first patient navigator encounter.
- From first patient navigator encounter to request for diagnostic test.
- From request for diagnostic test to diagnostic test.
- From diagnostic test to diagnosis.
The team gathered data about each step of the process, including the wait time. Analysis of the data showed variations in wait times between referral and diagnosis by focusing on defined steps. In this phase, 73 patients with total diagnosis time of more than 28 days were selected from the third quarter of 2017–18 (see Table 1).
The consultant team then met and discussed three potential approaches to improving the center’s wait times:
- Consultant-based solution: the consultant team would analyze the center’s system and offer solutions. Local staff would not be involved in the analysis and solution-finding process, and the consultants would not be involved in implementing their recommendations. In this method, the solution will be provided in the short term and the cost includes the consultants’ charge and the possible costs of implementation. The advantage is that the solution is based on analysis and experiment, and the cost and time would be acceptable for the cancer center. The risk would be in terms of feasibility of the solutions and implementation of them.
- Simulation model: a model would be created to simulate the system, analyze the current situation, and test improvement scenarios. This method is usually used for complicated systems and takes a relatively long time to complete. Creating a simulation model is costly and time-consuming. On the other hand, a detailed simulation model would be helpful to analyze all of the processes and it provides the opportunity of testing various scenarios in the model before implementing them in the real case. The risk in this method would be losing the time and budget before achieving the desired results.
- Kaizen event: the cancer center’s staff would be involved in analyzing the current situation as well as implementing solutions. This method is less costly than the other two, but it has the risk of failure to motivate employees to participate. Among other factors, participating will increase their workload for a number of days. Staff will need to take extra time to look at the process on top of performing their day-to-day jobs as usual. On the other hand, if the staff participate in finding the solutions, implementing the solutions would be more feasible and long-lasting.
Decision-Making to Choose the Appropriate Method
Given the three methods that the consultants proposed, the important decision point for Sarah is to decide which method she should pick. Which one has the greatest potential for success or greatest return on investment? To begin with, Sarah and the department managers considered the time commitment and cost for each of the three offered methods. They ruled out the simulation model due to high time commitment and cost. Another reason was based on the complexity of future analysis with simulation, as it would always require a specialist to work with and the staff could not work directly with the model. For each of the two remaining options, they considered the steps for data-gathering and process analysis to compare the advantages and benefits as well as challenges and limitations for each method. According to the descriptions, method 1 and method 3 both involve creating the following tools and plans:
- A value stream map (VSM): considers all processes from referral to cancer diagnosis, process times, and waiting times between processes. In this diagram, the total process is mapped, and the value-added and non-value-added activities can be recognized. Having an overall map of the whole process provides an understanding of sources of waste that
should be reduced. - A list of specific problems and possible solutions: after the identification of non-valueadded activities, specific problems that cause them should be listed. In this case, the most important non-value-added activity to be reduced is the wait time. These activities and
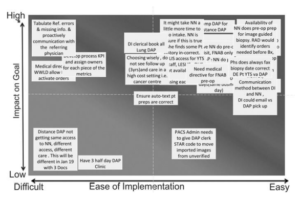
their sources should be identified, and possible solutions should be suggested. The value stream of the future is a modified map where sources of waiting have been removed as much as possible. - Impact/effort matrix: a matrix showing which solutions are easy vs. hard to implement and which have large vs. small impact. Another level of decision-making takes place in the implementation phase. The most appropriate solutions should be selected among the possible solutions. Categorizing the solutions based on their large or small impact and if they are easy or hard to implement helps to start with those solutions with larger impact that are easier to implement.
- Plans for action, communication, risk, and control. Solutions should be followed with action plans for detailed levels for the implementation. Also, possible risks and control actions should be considered.
Although the steps are similar in both methods, the approaches are different. The main differences can be identified by answering these two questions:
- Who is involved in the creation of the above analysis and implementation tools?
- What are the risks and advantages involved in the Kaizen (employee-led) vs. the
consultant-led methods?
In order to answer the above questions, Sarah’s team analyzed each method and listed the following complementary information about each of them:
- Method 1 (consultant-led): in this method, preparation of VSM, solutions, impact/effort matrix, and action plan are prepared mainly by the consultant with some collaboration from managers or staff. The accuracy of the VSM and solutions might be higher than
method 3, while the impact/effort matrix and action plan would not be very accurate as the implementation is assigned to staff and they had more knowledge about detailed actions and responsibilities. Also, there might be a lag between having the solutions and
implementing them as the staff need to understand and adjust to the proposed solutions and plans. This method is attractive because the consultant simply spells out the solution based on information gathered, and the local staff implement it and reap the rewards. No one is blamed for doing things “wrong” in the past. One risk may be that the staff will not be able to apply lessons learned in their process improvement to other areas of their work. - Method 3 (Kaizen): in this method, staff are involved in all phases from VSM preparation to implementation of the solutions. This method is attractive because each member of the staff gains a greater understanding of what everyone else does and how their work ultimately improves patients’ health outcomes. A risk may be that staff members feel their expertise is being questioned or that upper management will not support the ongoing practice of Kaizen once their key metrics are achieved.
In this step, Sarah reviewed previous attempts for process improvement and her notes about the previous observed challenges and problems. Sarah was aware of the resistance of the staff to be questioned about the performance of their tasks. Some of them had assumed the improvement approaches to be a judgment of their performance and were not very motivated about that. Another shortage was the lack of a good track record of monitoring key performance indicators (KPIs) and how the previous changes had impacted these.
Selected Solution
Based on the experience and the brainstorming between committee members, they finally concluded that if the staff were involved in the process of VSM preparation and problem-solving in the Kaizen method, it would help to create the feeling of belonging and participation. They would not see the process analysis as a judgmental activity about their task and instead would see it as a collaborative process of making improvements. Indeed, the support of managers is required to explain the objectives and convince staff to participate. On the other hand, the staff had firsthand experience about the sources of problems and the possible solutions. The missing part was an organized activity to gather the staff together and create a link between the steps and sequences of the processes and a holistic and systematic point of view for a shared goal.
Another advantage of the Kaizen method is that the staff will be able to continue the same analysis in the future and continuously apply the method. In the other method (consultant-led solution), the consultant is not necessarily involved in the implementation phase, since planning for the implementation is a separate phase. Even for advanced solutions, success cannot be guaranteed if the solutions cannot be implemented. Implementation of solutions that the staff had not been involved in creating would have a higher risk of resistance of staff. Additionally, Kaizen would be better for the long perspective as it provides the culture of continuous improvement in the system.
Therefore, according to the benefits and with the preparation for the upcoming challenges, Sarah made the decision to hold a Kaizen event with key staff members. The Japanese word Kaizen consists of two parts: Kai, meaning to modify or change, and Zen, meaning to think about making good or better (Liker, 2004). A small part of a Kaizen event is devoted to introducing Lean tools and methods, while most of the time is spent on collaboration and problem-solving by staff and stakeholders. The main objectives of the event are to analyze workflow, identify the roots of problems, find solutions, and then apply them with the help of local staff.
The Kaizen Event
After their initial analysis, the consultant team met with Sarah to decide who should be invited to the Kaizen event. First, it was agreed that medical oncologists, nurse navigators, and clerical staff should be present. After some discussion, they decided to add staff from the clinic as well as clinical and administrative leadership from diagnostic imaging, surgery, pathology and the cancer center. Finally, they also invited some patients and their family members. The Kaizen event took place in March 2018 and unfolded as follows.
Day 1
The consultant team started by presenting the main ideas of the Lean approach, focusing on identifying value-added and non-value-added activities, VSM, seven sources of waste, and root cause analysis to identify the reasons for waste. The team then asked staff members for their opinions about the processes that involved significant wait times. The main purpose of this first day was to gain a clear and complete understanding of the center’s diagnostic process. Every staff member insisted they were doing their best and that the source of waiting was not in their area of responsibility. They were right—everyone was doing their job with a high level of responsibility—but no one was responsible for analyzing the total workflow from start to finish. At this point, the consultant team decided it was necessary to help the staff develop new insights about the current situation and the real source of the problem. The consultants encouraged the group to see the process from the points of view of other people and understand the effect of their work on others. As is normal at these events, it was difficult to break the ice and get staff members to open up in this discussion. To avoid any fears of finger-pointing, Sarah and the vice
president of the hospital reassured everyone of their support.
Day 2
The process analysis continued the second day, with participants being asked to create a VSM of the current workflow. Each person wrote down and explained what their responsibility was. This might include a description of their tasks, how much time each task took on average, and how long they waited for the completion of the prerequisite tasks. The consultants might add some
observations based on their analysis conducted before the event, raising points that might not have been considered by staff. For example, a doctor reported that the time between diagnostic test and results was five working days. This was an assumption based on his experience, but data analysis showed the wait was usually just two days. The doctor did not follow up on results before five days because that was the delay he expected. With this experience, participants started to realize that some wait times between processes could be reduced. Figure 1 shows the initial part of the VSM.
Figure 1. VSM Mapping

Day 3
The consultant team was aware that the cancer diagnosis process was fragmented and involved several parties. By creating the VSM, participants could reach this conclusion themselves. On the third day of the event, they were encouraged to analyze what was happening at each step of the process, keeping the whole picture in mind, in order to understand the delays and their causes. After identifying a source of waiting, participants brainstormed to find solutions. Meanwhile, the consultants asked leading questions to point them in the right direction. They also provided examples of possible solutions and tried to extract the correct solutions from their discussions. Examples of sources of waiting and suggested solutions included the following:
- Source of waiting: one reason for waste was found in handoffs that interrupted process flow, such as the handoff from referral to first navigator encounter (step 1 in Table 1). When a referral came from a clinic to the hospital cancer center, it took some time for the request to be registered, so a pile-up was created. Sometimes a request would be forgotten when a new task arrived.
- Solution: to reduce waiting and improve the flow of this handoff, the number of transmissions from clinic to cancer center was increased to twice a day from once a day, and an individual was assigned responsibility for verifying the
transmissions.
- Solution: to reduce waiting and improve the flow of this handoff, the number of transmissions from clinic to cancer center was increased to twice a day from once a day, and an individual was assigned responsibility for verifying the
- Source of waiting: in step 3, from a request for a diagnostic test to the test being carried out, wait times were increased by duplication of effort in arranging patient appointments. The clerical staff in both the clinic and the cancer center managed this process, so patients often became confused about which office to contact if they had issues with appointments or questions about their testing.
- Solution: appointments would only be requested by the cancer center, and the patient navigator was assigned responsibility for controlling this task.
- Source of waiting: patients noted that they had limited knowledge of the roles of the healthcare team members, their options for care, and their overall care journey before and after diagnosis.
- Solution: Training sessions would be provided for patients and their family members.
Day 4
Many possible solutions were suggested for improving the process flow, but not all of them were feasible, or their impact was not expected to be significant. It was necessary to determine whether a suggestion would be easy or hard to implement and whether its implementation would have a large or small effect on reducing wait times. For example, one cause of waiting was that, in clinics, patient information was registered on paper, while the hospital had an electronic registration system. However, even if the clinics had electronic records, health system policies did not allow the transfer of patient information between centers. Therefore, this wait cause was
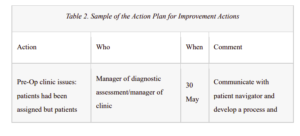
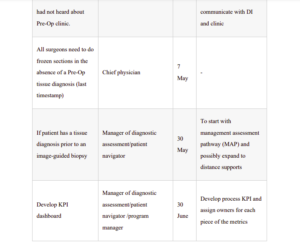
not within the scope of the Kaizen improvement program. Under guidance from the consultant team, the participants focused on feasible changes to workflow and categorized them by moving each suggestion into the appropriate quadrant on an improvement impact/effort matrix (see Figure 2). After selected solutions were prioritized, the next step was implementation. An action plan was prepared to highlight the tasks to be done and the person responsible for each task (see Table 2). For example, one of the actions was to involve patients, making the process easier for them and developing educational materials for them and their families. Another document prepared at the end of the Kaizen event was a communication plan to identify activities that would require communication between team members. Also, a risk plan identified potential risks during the implementation phase, as well as preventive measures. Finally, a control plan was developed to control the progress of the project and stay on track, for example by regular updating of performance factors.
Figure 2. The Impact/Effort Matrix
Source: Consultant’s archive
The Results
Between July 2017 and March 2018, only 47% of patients met the target wait time of 28 days from referral to diagnosis, compared with the target percentage of 65%. During that same period, an average of 53 patients were seen for consultation each quarter. Over the subsequent nine months, from April to December 2018, following the implementation of the action plan developed at the Kaizen event, the percentage of patients meeting the target wait time rose to 88.4% and the number of patients seen for consultation doubled. Between March 2017 and August 2018, patient volumes rose from 75 to 124 patients per quarter, an improvement of 40%. In the same period, the percentage of patients meeting the provincial wait time target, from consultation to diagnosis, increased from 47% to 75%.
On the first day of the Kaizen event, the participants thought some of the suggested solutions were too simple to solve their complicated problem. Therefore, when Morteza asked them to anticipate a day for celebrating the success of the Lean project, they doubted it would happen. Two months later, they were astonished by the results. The center had doubled capacity and risen from thirteenth to first position in the provincial rankings. The initial belief that it would take large-scale changes to reduce wait times and find additional clinic capacity turned out to be wrong. “It was proven that if we can get some hours in reduction in each process, we can have a huge improvement in the whole flow,” Sarah said. The staff celebrated their success at the end of August, recognizing that they had not only increased the performance and ranking of their center but also helped many cancer patients

